Basketball might seem a strange place to start but hear me out.
Whether its watching NBA super athlete Lebron James crush the group of antagonists known as “The Goons” in 2021’s Space Jam, Netflix’s fascinating Michael Jordan documentary “The Last Dance”, or tuning into the 2008 Olympic gold medal game which saw USA take on one of the most formidable Spanish sides ever to be put together, it is extremely likely you will know about basketball.
You may not know the rules, but you know the cultural and commercial impact the sport has had on the globe, not just Northern America.
What’s an NBA team worth in business terms?
The average NBA teams boasts a colossal net worth of $5.4 billion dollars (£3.9B)! To put this into context, this sits at just over 3.5 times the average net worth of a premier league football team, members of the biggest league within the biggest sport globally.
Although basketball may not have the same reach as their more metatarsal enthusiastic peers, commercially, they have got the numbers right.
In the 2023-4 season, 28 of the league’s 30 teams reported either breakeven or profitable outcomes, meaning 87.5% of franchises maintained stable or positive financial performance.
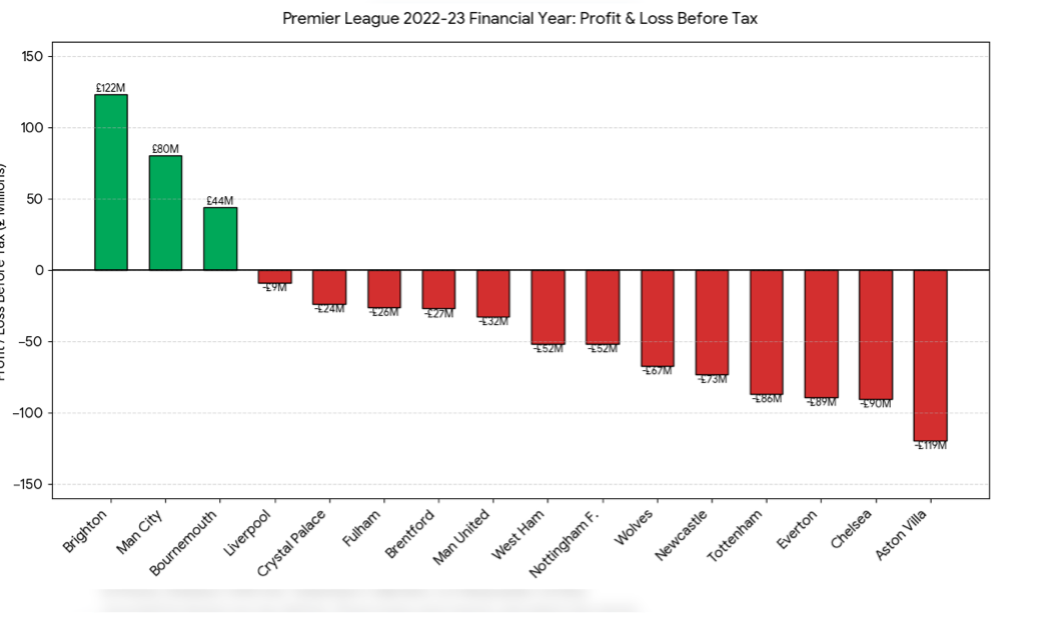
By contrast, the Premier League has yet to demonstrate a similar level of financial consistency. In the preceding 2022–23 season, 17 of its 20 clubs reported operating losses before tax, underscoring a markedly different financial landscape.
What can we learn major league business performance?
As members of the business community, its often apparent to all of us that we answer to the numerically defined deities that are the balance sheets, and we mostly want to see our good friend profit soaring above us.
Identifying just how we got profit to that wonderful high ground is a challenge and value, and one many sporting organisations struggle with.
In 2003, famed economics author Michael Lewis released “Moneyball”, a fantastic telling of how Billy Beane’s, general manager of Oakland Athletics baseball team, used of analytics to win against MLB teams with more buying power and go on a 20-0 win streak.
More recently, Ian Graham, founder of Ludonautics released “How to win the Premier League”. The book gives a thrilling insight into the statistical analytics and strategies used by Liverpool F.C. to win the premier league in the 2024-25 season.
These stories talk to us as technologists and commercial strategists; they tell us insight into data can become valuable.
Whether or not you can use these techniques to win seasons isn’t a question needed asking today. We’re looking at the value these skillsets and techniques can bring to any organisation.
Does data analysis yield an economic return?
In 2025, the Journal of Sports Economics released a study focussing on the return on investment of analytics on NBA teams’ success.
The paper was able to identify a positive and statistically significant effect, showing that clubs allocating greater resources to analytics tend to achieve stronger performance outcomes.
Even after accounting for factors such as team quality, injuries, they further quantified the impact of basketball analytics by linking it directly to team performance.
Their findings suggest that adding 0.8 of a data analyst correlates with one additional win over the course of a season. By comparison, achieving the same marginal gain would require an increase of approximately $9.6 million (£7.8 million) in team salary.
The contribution of a single data analyst would the marginal impact in the order of $9–12M in player-equivalent value, particularly at lower levels of staffing.
Now, we will struggle to find any Data Engineer or Analyst that is being paid millions of pounds (if we do then data is the pool you’ll find me splashing in!) and this isn’t the expectation.
How can data insights drive marginal gains?
The expectation is, as business leaders, to truly understand the insights into the data that flows through our economic junctions daily.
It is not wild to think a mid-sized organisation will see tens of millions of data points being interacted with daily. Within every one of those data points are nuggets of information that can be stockpiled and transformed into one mutated large monster of a nugget.
Although scary looking and possibly the worst comic book villain ever created, that would be your most useful tool into making data driven decisions from a leadership position.
Data Engineering and Analytics are proven foundations for trusted decision making. They help businesses remove narrative and focus on numerical facts. Data Engineering helps you obtain and clean the data to ask the questions whilst analytics helps you answer them.
The International Institute of Business Analysis recently released research showing that high-performing organisations achieve up to the times greater return from data analytics initiatives compared to lower-performing peers. More mature analytics capabilities can generate 29-35% ROI compared to just 12-18% of more basic level analytics. These differences are the likes of predictive and prescriptive analytics.
How can we make better decisions?
Data isn’t just a tool for looking back and observing. If we step back to basketball for a moment, Data Engineering and Analytics has proven to affect in game strategy too. Modern basketball is no longer focussed on big dunks, it’s a three-point shooters’ game.
Daryl Morey is one of, if not, the single biggest contributor to the modern game of basketball. Morey was famously not a “Basketball Guy”, he was an MIT graduate and had two obsessions, data and basketball.
Morey’s legacy is built on one small piece of statistical analysis: three is worth 50% more than a two, so if you can shoot them at even a moderately efficient rate, they're mathematically superior to mid-range jumpers.
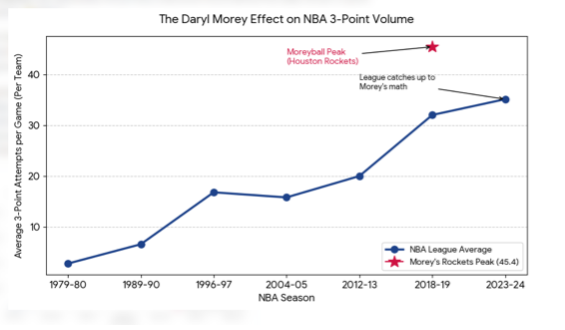
Eventually the rest of the league followed, not just in “Moreyball” but most importantly the adoption of statistic modelling and the application of analytics within their product.
This is where it’s important for us to be as commercial strategists; leading the way in the adoption of statistics and analysis within our organisations, identifying efficiencies and anomalies.
So, how can IJYI help my business get these insights?
At IJYI, we’ve helped multiple businesses adopt more data driven decision-making strategies.
It must be done right, and it must be planned out. It’s not simply turning the software on and watching the information roll in. Your data is an asset but only if it is accessible, organised and accurate.
Effective infrastructure and data governance are critical to unlocking the value of large-scale data assets, ensuring that information is not only abundant but also accessible, structured, and reliable.
Your organisation must prioritise the centralisation of data by breaking down departmental silos and leveraging modern cloud-based data warehouses such as Microsoft Azure Synapse Analytics to create a unified data environment.
Robust data governance frameworks are essential to clearly define data ownership, standardise collection processes, and control access, ensuring compliance with regulatory requirements such as GDPR while safeguarding data integrity.
Finally, maintaining high data quality through rigorous cleansing and well-designed ETL (Extract, Transform, Load) pipelines is fundamental, we’re trying to add value through decision making and insights, if the data is incorrect to begin with, so will the decision. Inaccurate or inconsistent data will significantly undermine analytical outcomes and decision-making.
Sound great, but how does my business win our ‘league’?
We need to think about what exactly we’re trying to achieve. There must be a strategic alignment of data and analytics initiatives with core business objectives is essential to ensure meaningful impact and avoid overly broad or unfocused implementation.
Rather than attempting to analyse all available data simultaneously, organisations should begin by defining clear, targeted business questions that directly address operational or strategic challenges, such as identifying customer segments with the highest churn rates or diagnosing inefficiencies within supply chain processes. Profitability, efficiency, and customer retention are always going to be some of the easiest wins when using data tools to create strategy.
Most importantly a successful data-driven transformation depends not only on technology but also on cultivating the right organisational culture, skills, and level of data literacy across the workforce.
IJYI is full of technical specialists such as data scientists, engineers and architects. Beyond this, organisations benefit from “data translators” who can bridge the gap between complex analytical outputs and practical business strategy, ensuring insights are effectively applied to real-world decisions.
Embedding data literacy across all levels of the organisation is critical. Equipping non-technical staff with the ability to interpret data, understand statistical variation, and challenge intuition-based decision-making with evidence-based insight.
IJYI who can help you start sinking those three-point shots. The millions should come later.